Xdebug
The Xdebug extension allows you to easily profile your code.
Installation
The Xdebug extension is enabled by default.
Generate a profile (cachegrind)
The profile command is very similar to the run command:
$ phpbench xdebug:profile examples/HashBench.php --progress=none
3 profile(s) generated:
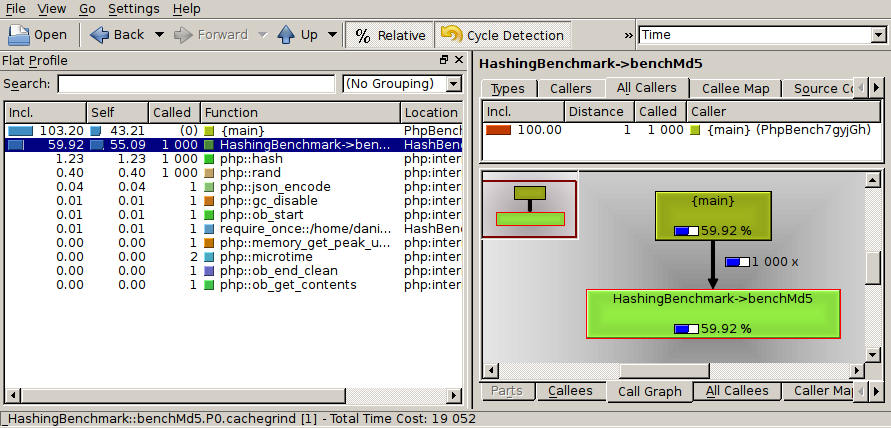
profile/_HashingBenchmark::benchMd5.P0.cachegrind
profile/_HashingBenchmark::benchSha1.P0.cachegrind
profile/_HashingBenchmark::benchSha256.P0.cachegrind
A single profile is generated for each subject in the benchmark and placed in
the directory profile by default.
The generated profiles can be viewed with a cachegrind viewer such as kcachegrind (linux) or webgrind (web based).
Automatically launch a GUI
It is possible to automatically launch a GUI for each of the profiles using
the --gui option.
By default PHPBench will attempt to locate the kcachegrind executable. If
you do not have kcachegrind you can specify a different executable using
the --gui-bin option.