Benchmark Runner
The benchmark runner is a command line application which executes the benchmarks and generates reports from the results.
Running Benchmarks
To run all benchmarks in a specific directory:
$ phpbench run /path/to
To run a single benchmark class, specify a specific file:
$ phpbench run /path/to/HashBench.php
To run a single method of a single benchmark class, use the --filter
option:
$ phpbench run /path/to/HashBench.php --filter=benchMd5
Groups can be specified using the --group option:
$ phpbench run /path/to/HashBench.php --group=hash
Note
Both --subject and --group options may be specified multiple
times.
Filtering
The --filter option accepts a regex without the delimiters and matches
against a string such as HashBench::benchMd5, so all of the following are
valid:
$ phpbench run /path/to --filter=benchFoo
$ phpbench run /path/to --filter=HashBench::benchFoo
$ phpbench run /path/to --filter=Hash.*
Overriding Iterations and Revolutions
The benchmark runner can override the number of revolutions and iterations which will be executed:
$ phpbench run /path/to/HashBench.php --iterations=10 --revs=1000
You may specify these options multiple times.
Overriding the Bootstrap
You can override or set the Bootstrap using the
--bootstrap option:
$ phpbench run /path/to/HashBench.php --bootstrap=vendor/autoload.php
Assertions: Overriding and Toleration
Use the --assert option to introduce or override assertions:
$ phpbench run /path/to/HashBench.php --assert="stat: mode, value: 10"
This will assert that ALL variants must have a mode less than 10. For more information on assertions see Assertions.
Failing assertions will cause PHPBench to exit with code 2. If you want to
tolerate failures (f.e. in an unstable CI environment) you can use the
--tolerate-failure option.
For more information about assertions see Asserters.
Generating Reports
By default PHPBench will run the benchmarks and tell you that the benchmarks have been executed successfully. In order to see some useful information you can specify that a report be generated.
By default there are two reports default and aggregate, and they can
be specified directly using the --report option:
$ phpbench run /path/to/HashBench.php --report=default
See the Reports chapter for more information on how you can configure reports.
Note
If you want to suppress all other output and only show the output from the
reports you can use the --progress=none option. This is especially useful when
piping a report to another program.
Retry Threshold
PHPBench is able to dramatically improve the stability of your benchmarks by retrying the iteration set until all the deviations in time between iterations fit within a given margin of error.
You can set this as follows:
$ phpbench run /path/to/HashBench.php --retry-threshold=5
The retry threshold is the margin of error as a percentage which is allowed between deviations. Generally the lower this value, the higher the stability, but the longer it will take for a set of iterations to be resolved.
By default the retry threshold is disabled.
You may also set the retry threshold in the configuration.
Changing the Output Medium
By default PHPBench will output the reports to the console using the
console output. The output can be changed using the --output option.
For example, to render a HTML document:
$ phpbench run /path/to/HashBench.php --report=default --output=html
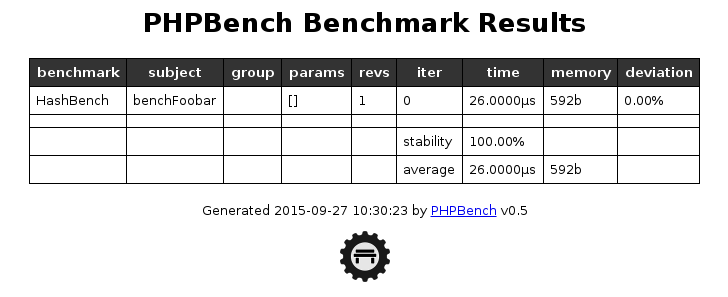
Example of HTML output:
See the Report Renderers chapter for more information.
Deferring Report Generation
You can store benchmark results which can then later be used later to generate reports.
There are two ways to do this: Firstly you may dump the results to an XML file, secondly you can use a storage driver to persist them.
To dump the benchmark results to an XML file use the --dump-file option:
$ phpbench run /path/to/HashBench.php --dump-file=report.xml
You can then generate reports using the report command:
$ phpbench report --file=report.xml --report=default
Alternatively (or in a addition) you may use the storage driver as follows:
$ phpbench run /path/to/HashBench.php --store
Then generate reports using a query:
$ phpbench report --query='benchmark: "MyBench"' --report=aggregate
This method is highly mighty. See the storage chapter for more information.
Comparing Results
You can compare the results of two or more sets of results using the compare report.
First you should generate a suite result document for each separate implementation and specify a tag:
# .. configure for implementation A
$ phpbench run --tag=impl_a --store
# .. configure for implementation B
$ phpbench run --tag=impl_b --store
# .. configure for implementation C
$ phpbench run --tag=impl_c --store
Now you can use the report command and specify the compare report to compare the results for each implementation side-by-side:
$ phpbench report --uuid=tag:impl_a --uuid=tag:impl_b --uuid=tag:impl_c --report='{extends: compare, compare: tag}'
+--------------+----------+--------+--------+------+-----------------+-----------------+-----------------+
| benchmark    | subject  | groups | params | revs | tag:impl_a:mean | tag:impl_b:mean | tag:impl_c:mean |
+--------------+----------+--------+--------+------+-----------------+-----------------+-----------------+
| HashingBench | benchMd5 |        | []     | 1000 | 0.957μs         | 0.939μs         | 0.952μs         |
+--------------+----------+--------+--------+------+-----------------+-----------------+-----------------+
Progress Reporters
By default PHPBench issues a single . for each benchmark subject executed.
This is the dots progress reporter. Different progress reporters can be
specified using the --progress option:
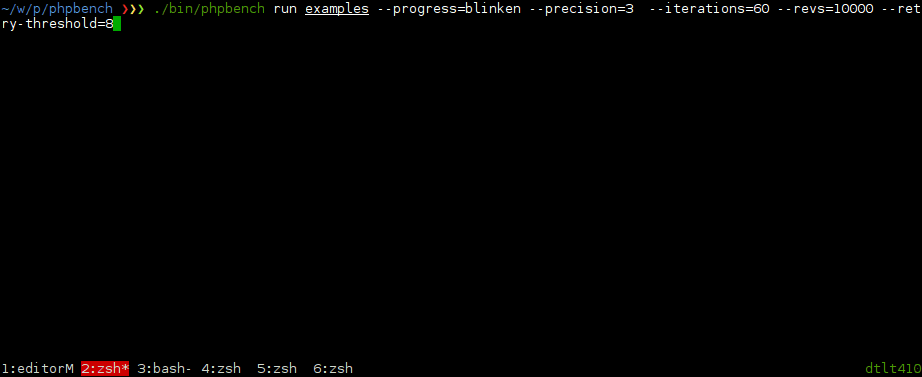
blinken progress logger.
$ phpbench run /path/to/HashBench.php --progress=classdots
The built-in progress loggers are:
verbose: The default logger, format: [R<retry nb.>] I<iter nb.> P<parameter set nb.> <mean|mode per rev.> <standard deviation per rev.> <relative standard deviation per rev.> ).travis: Similar to verbose, but with no fancy console manipulation. Perfect for travis.dots: Shows one dot per subject (like PHPUnit).classdots: Shows the benchmark class, and then a dot for each subject.blinken: Highly visual progress logger.histogram: Shows a histogram with 8 vertical levels and 16 bins for each iteration set.
Note
PHPBench is aware of the CONTINUOUS_INTEGRATION environment variable set
by travis. If this variable is set then the default logger will
automatically be changed to travis and the dots progress logger will
not do any fancy stuff.
All of the progress reports contain the following footer:
3 subjects, 30 iterations, 30000 revs, 0 rejects
min [mean mode] max: 0.84 [1.13 1.12] 1.66 (μs/r)
⅀T: 33987μs μSD/r 0.16μs μRSD/r: 14.92%
It provides a summary of the minimum, mean, mode, and maximum subject times, given microseconds per revolution. ⅀T is the aggregate total time, μSD/r is the mean standard deviation, and μRSD/r is the mean relative standard deviation.
Warning
These summary statistics can be misleading. You should always verify the individual subject statistics before drawing any conclusions.
Configuration File
A custom configuration file can be specified with the --config option. See
the Configuration chapter for more information on configuration.
Exit codes
The following exit codes can occur:
0: Everything was fine.1: Errors encountered in benchmarks.2: Assertion failures.255: Internal error