Xdebug
The Xdebug extension allows you to easily profile your code using function traces or by generating cachegrind profiles.
The commands are very similar to the standard run command with the
difference that only single iterations are performed.
Note
Xdebug needs to be installed, however it does NOT need to be activated by default. PHPBench will automatically try and load and configure the extension even if it is disabled.
Tip
You can use the Xdebug executors with the standard run command by
specifying either xdebug_profile or xdebug_trace with the
--executor option.
Installation
The Xdebug extension is bundled with PHPBench, it just needs to be activated:
{
   "extensions": [
       "PhpBench\\Extensions\\XDebug\\XDebugExtension"
   ]
}
Alternatively you can activate it directly from the CLI using the
extension option:
$ phpbench xdebug:profile examples/HashBench.php --extension="PhpBench\\Extensions\\XDebug\\XDebugExtension"
Function Tracing
Function tracing provides a simple way to profile your benchmark subjects:
$ ./bin/phpbench xdebug:trace benchmarks/Micro/Math/StatisticsBench.php

+-----+-------+----------+-----------+-----------+---------------------------------------+------------------------------------------------+
| #   | Level | Mem      | Time      | Time inc. | Function                              | File                                           |
+-----+-------+----------+-----------+-----------+---------------------------------------+------------------------------------------------+
| 777 | 4     | 922,976b | 0.015284s | 192μs     | PhpBench\Math\Statistics::stdev()     | ./benchmarks/Micro/Math/StatisticsBench.php:40 |
| 778 | 5     | 923,024b | 0.015294s | 168μs     |  PhpBench\Math\Statistics::variance() | ./lib/Math/Statistics.php:29                   |
| 779 | 6     | 923,024b | 0.015304s | 34μs      |   PhpBench\Math\Statistics::mean()    | ./lib/Math/Statistics.php:44                   |
| 780 | 7     | 923,072b | 0.015313s | 9μs       |    array_sum()                        | ./lib/Math/Statistics.php:73                   |
| 781 | 7     | 923,120b | 0.015326s | 8μs       |    count()                            | ./lib/Math/Statistics.php:79                   |
+-----+-------+----------+-----------+-----------+---------------------------------------+------------------------------------------------+
You can enable showing arguments using the --show-args option:
$ ./bin/phpbench xdebug:trace benchmarks/Micro/Math/StatisticsBench.php --show-args
+-----+-------+----------+-----------+-----------+----------------------------------------------------------------------------------+------------------------------------------------+
| #   | Level | Mem      | Time      | Time inc. | Function                                                                         | File                                           |
+-----+-------+----------+-----------+-----------+----------------------------------------------------------------------------------+------------------------------------------------+
| 777 | 4     | 922,912b | 0.021977s | 244μs     | PhpBench\Math\Statistics::variance(                                              | ./benchmarks/Micro/Math/StatisticsBench.php:33 |
|     |       |          |           |           |  array (0 => 10, 1 => 100, 2 => 42, 3 => 84, 4 => 11, 5 => 12, 6 => 9, 7 => 6)   |                                                |
|     |       |          |           |           |  ???                                                                             |                                                |
|     |       |          |           |           | )                                                                                |                                                |
| 778 | 5     | 922,960b | 0.021992s | 49μs      |  PhpBench\Math\Statistics::mean(                                                 | ./lib/Math/Statistics.php:44                   |
|     |       |          |           |           |   array (0 => 10, 1 => 100, 2 => 42, 3 => 84, 4 => 11, 5 => 12, 6 => 9, 7 => 6)  |                                                |
|     |       |          |           |           |  )                                                                               |                                                |
| 779 | 6     | 923,008b | 0.022005s | 13μs      |   array_sum(                                                                     | ./lib/Math/Statistics.php:73                   |
|     |       |          |           |           |    array (0 => 10, 1 => 100, 2 => 42, 3 => 84, 4 => 11, 5 => 12, 6 => 9, 7 => 6) |                                                |
|     |       |          |           |           |   )                                                                              |                                                |
| 780 | 6     | 923,056b | 0.022024s | 11μs      |   count(                                                                         | ./lib/Math/Statistics.php:79                   |
|     |       |          |           |           |    array (0 => 10, 1 => 100, 2 => 42, 3 => 84, 4 => 11, 5 => 12, 6 => 9, 7 => 6) |                                                |
|     |       |          |           |           |   )                                                                              |                                                |
+-----+-------+----------+-----------+-----------+-----------------------------------------------------------------------------------+------------------------------------------------+
Profiling (cachegrind)
The profile command is very similar to the run command:
$ phpbench xdebug:profile examples/HashBench.php --progress=none

3 profile(s) generated:

    profile/_HashingBenchmark::benchMd5.P0.cachegrind
    profile/_HashingBenchmark::benchSha1.P0.cachegrind
    profile/_HashingBenchmark::benchSha256.P0.cachegrind
A single profile is generated for each subject in the benchmark and placed in
the directory profile by default.
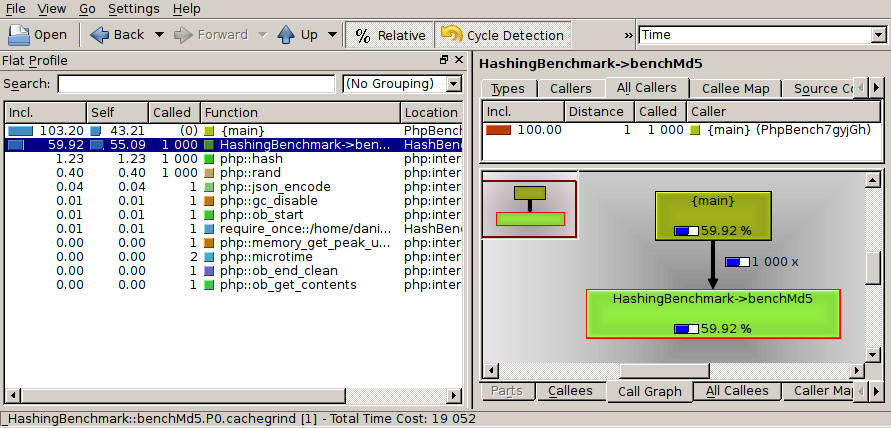
The generated profiles can be viewed with a cachegrind viewer such as kcachgrind (linux) or webgrind (web based).
It is possible to automatically launch a GUI for each of the profiles using
the --gui option. By default PHPBench will attempt to locate the
kcachegrind executable. If you do not have kcachegrind you can specify
a different executable using the --gui-bin option.