Bar Chart Aggregate
Render generate a bar chart from aggregated values
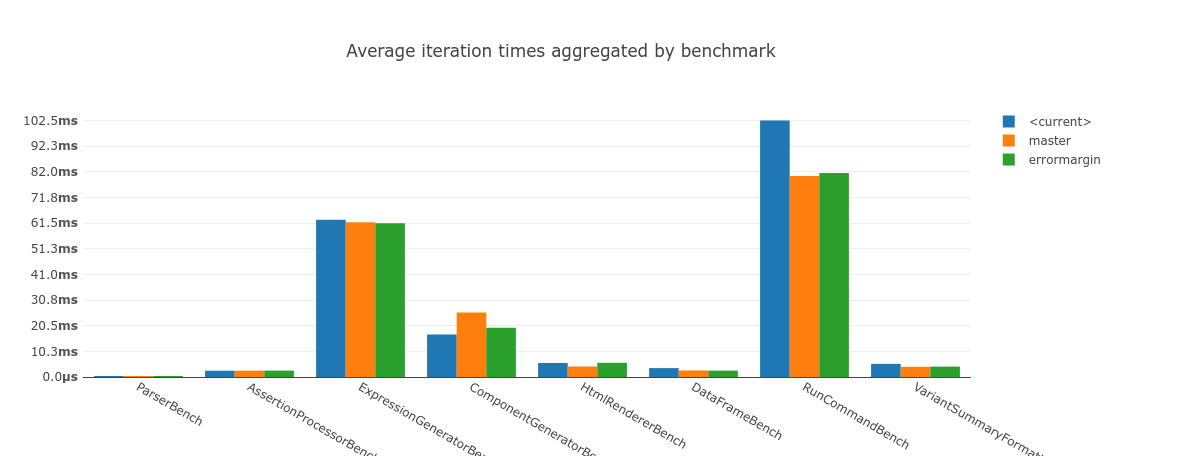
HTML output
Options
- title:
Type(s):
[string, null], Default:NULLTitle for the barchart
- x_partition:
Type(s):
[string, string[]], Default:[]Partition the data for aggregation on the X axes. Partitions are made of rows sharing the same values in the expression or columns (which can be expressions) given here.
- bar_partition:
Type(s):
[string, string[]], Default:[]Partition the individual bars for each X partition.
- y_axes_label:
Type(s):
string, Default:yValueExpression to evaluate the Y-Axis label. It is passed
yValue(actual value of Y),partition(the set partition) andframe(the entire data frame)- x_axes_label:
Type(s):
[null, string], Default:NULLExpression to evaluate the X-Axis label, is passed
xValue(default X value according to the X-partition),partition(the x-partition), andframe(the entire data frame)- y_error_margin:
Type(s):
[string, null], Default:NULLExpression to evaluate to determine the error margin to show on the chart. Leave as NULL to disable the error margin
- y_expr:
Type(s):
string, Default:n/aExpression to evaluate the Y-Axis value, e.g.
mode(partition["result_time_avg"])
Example
Given the following configuration:
{
    "runner.path": "NothingBench.php",
    "runner.executor": "debug-example",
    "runner.iterations": 20,
    "runner.executors": {
        "debug-example": {
            "executor": "debug",
            "times":[10, 20, 30, 40, 50]
        }
    },
    "runner.env_enabled_providers": ["test"],
    "report.generators": {
        "chart": {
            "generator": "component",
            "components": [
                {
                    "component": "bar_chart_aggregate",
                    "title": "Example Bar Chart",
                    "x_partition": ["iteration_index"],
                    "bar_partition": ["suite_tag"],
                    "y_expr": "mode(partition['result_time_avg'])",
                    "y_axes_label": "yValue as time precision 1"
                }
            ]
        }
    }
}
When we run PHPBench with the configured report above:
phpbench run --report=chart
Then it generates the following with the console renderer:
Example Bar Chart

50.0μs    │         █         █         █         █
43.8μs    │       ▄ █       ▄ █       ▄ █       ▄ █
37.5μs    │       █ █       █ █       █ █       █ █
31.3μs    │     ▇ █ █     ▇ █ █     ▇ █ █     ▇ █ █
25.0μs    │   ▂ █ █ █   ▂ █ █ █   ▂ █ █ █   ▂ █ █ █
18.8μs    │   █ █ █ █   █ █ █ █   █ █ █ █   █ █ █ █
12.5μs    │ ▅ █ █ █ █ ▅ █ █ █ █ ▅ █ █ █ █ ▅ █ █ █ █
6.3μs     │ █ █ █ █ █ █ █ █ █ █ █ █ █ █ █ █ █ █ █ █
          └─────────────────────────────────────────
            1 2 3 4 5 6 7 8 9 0 1 2 3 4 5 6 7 8 9 0

[█ <current>]

1: 0  2: 1  3: 2  4: 3
5: 4  6: 5  7: 6  8: 7
9: 8  10: 9  11: 10 12: 11
13: 12 14: 13 15: 14 16: 15
17: 16 18: 17 19: 18 20: 19
See Also
Hashing: Example barchart comparing hashing algorithms.